
- September 4, 2026
- Posted by: Tresmark
- Category:

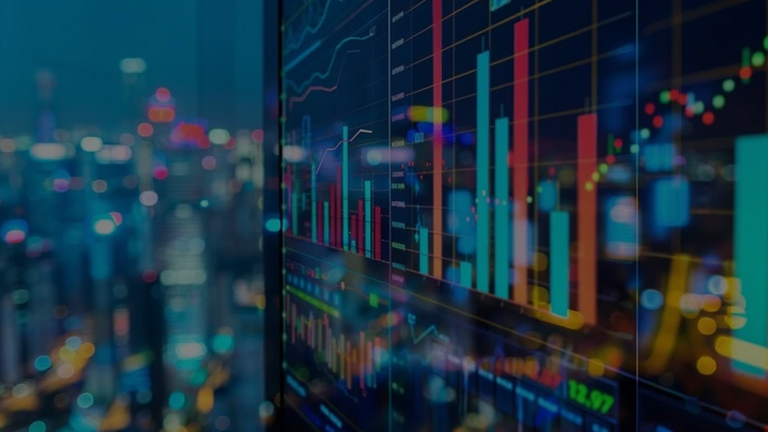
In today’s fast-moving financial environment, market dashboards have become essential tools for CFOs, treasury teams, investment professionals, and financial decision-makers. As organizations manage increasing exposure to foreign exchange, fixed income, equities, commodities, money markets, and macroeconomic developments, having access to clear and timely financial information is critical for effective decision-making.
A market dashboard is no longer simply a collection of charts and financial indicators. A well-designed dashboard can bring together complex market information, highlight important developments, and provide finance teams with the visibility required to manage risk, liquidity, investment positions, and financial exposure.
For modern finance functions, the objective is not to display as much information as possible. The goal is to present the right information in the right format at the right time, enabling faster, clearer, and more informed financial decisions.
What Is a Market Dashboard?
A market dashboard is a centralized digital interface that displays financial market data, analytics, key metrics, and performance indicators in an easy-to-understand format.
Depending on the organization’s requirements, a market dashboard can aggregate information from multiple financial markets, including:
- Foreign exchange (FX) markets
- Fixed income and interest rates
- Equity markets
- Commodities
- Money markets
- Yield curves
- Macroeconomic indicators
- Historical market data
For treasury teams, this creates a centralized view of financial markets and relevant exposures, reducing the need to collect information manually from multiple systems, spreadsheets, and market sources.
Why Market Dashboards Matter for CFOs and Treasury Teams
CFOs and treasury professionals operate in an environment where timing, accuracy, and visibility are increasingly important. Currency movements, interest-rate decisions, inflation releases, government securities auctions, and global commodity prices can all influence financial positions and business decisions.
An effective market dashboard helps teams:
- Track market movements in real time
- Identify financial risks and opportunities
- Monitor key financial indicators
- Improve decision-making efficiency
- Maintain greater visibility across financial markets
- Compare current market conditions with historical trends
This allows finance teams to move beyond fragmented and reactive reporting and adopt a more proactive approach to financial management.
Key Features of a Good Market Dashboard
A high-quality market dashboard should combine reliable financial data with intuitive visualization, customization, alerts, and connectivity.
Real-Time Data Integration
Real-time market data is one of the most important characteristics of an effective dashboard. Outdated or delayed information can reduce the value of financial analysis, particularly during periods of market volatility.
A strong dashboard can integrate live market data to help users:
- Monitor FX rates and currency movements
- Track interest rates and yield curves
- Analyze commodity price changes
- Monitor equity market movements
- Identify significant market developments
Real-time data allows treasury professionals to work with current market information when assessing financial exposures and making decisions.
Multi-Asset Coverage
Modern finance teams rarely monitor a single asset class. A good market dashboard should therefore provide comprehensive multi-asset visibility within a centralized environment.
This can include:
- Foreign exchange
- Fixed income
- Equities
- Commodities
- Money markets
- Interest rates
- Yield curves
Multi-asset coverage reduces the need to switch between multiple systems and allows financial professionals to develop a broader understanding of market conditions.
This can support:
- Holistic market analysis
- Better risk assessment
- Improved portfolio monitoring
- More informed financial planning
- Greater market visibility
Customization and Flexibility
Different organizations have different financial priorities. A CFO may focus on high-level market indicators and major financial exposures, while a treasury professional may require detailed information on FX rates, interest rates, liquidity, and fixed-income markets.
A flexible dashboard should allow users to customize:
- Data views and layouts
- Key metrics and KPIs
- Market watchlists
- Alerts and notifications
- Relevant financial indicators
- Historical analysis
Customization ensures that users can focus on information relevant to their responsibilities rather than navigating through unnecessary data.
Advanced Data Visualization
Financial data can become complex when multiple markets, instruments, and time periods are analyzed simultaneously. Effective visualization helps convert large datasets into information that can be understood quickly.
Useful visualization formats can include:
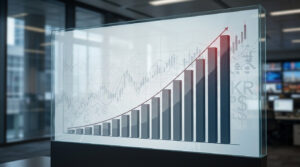
- Line charts for market trends
- Bar charts for comparisons
- Heatmaps for market movements
- Yield curves for interest-rate analysis
- Historical charts for trend analysis
- Interactive charts for deeper analysis
Clear visualization improves trend identification, data interpretation, and communication across finance teams.
Alerts and Notifications
Financial markets can move rapidly, and important developments may occur between regular reporting cycles. Real-time alerts can help treasury teams identify significant changes without continuously monitoring every market.
A good dashboard can provide alerts for:
- Significant price movements
- FX threshold breaches
- Interest-rate changes
- Market volatility spikes
- Changes in selected financial indicators
- Important market events
These alerts allow treasury professionals to respond more quickly to potential risks and changing market conditions.
API Integration and Connectivity
Modern market dashboards should be able to connect with existing financial systems. API integration allows financial data to move between platforms without relying heavily on manual processes.
Dashboards can integrate with:
- Treasury management systems (TMS)
- Enterprise resource planning (ERP) platforms
- Trading applications
- Risk management systems
- Internal financial applications
- Reporting and analytics systems
This connectivity can improve data flow, reduce manual data entry, and support greater automation across treasury and financial operations.
Benefits of an Effective Market Dashboard
A well-designed market dashboard can deliver several operational and strategic benefits for CFOs and treasury teams.
Faster Decision-Making
Centralized access to timely financial information reduces the time required to collect and interpret market data from different sources.
CFOs and treasury professionals can quickly review key indicators, identify changes, and determine whether further analysis or action is required.
Improved Risk Management
A comprehensive dashboard can help financial professionals continuously monitor exposures and changing market conditions.
This can include:
- Currency exposure
- Interest-rate risk
- Commodity price volatility
- Portfolio movements
- Market liquidity conditions
- Fixed-income positions
By providing timely visibility, dashboards can support more proactive risk management strategies.
Enhanced Operational Efficiency
Consolidating financial information into a centralized dashboard can reduce the need for manual data collection and repetitive reporting.
This can help treasury teams:
- Reduce manual market monitoring
- Minimize data duplication
- Improve reporting efficiency
- Reduce time spent collecting information
- Focus more on analysis and strategy
Better Financial Visibility
A well-designed dashboard provides a consolidated view of relevant financial information.
This can help CFOs and treasury teams understand how market movements may affect:
- Liquidity
- Financial exposures
- Investment positions
- Funding requirements
- Portfolio performance
- Overall financial planning
Greater visibility supports more effective planning and forecasting.
Common Mistakes to Avoid
Not every dashboard improves decision-making. Poor design, excessive information, or unreliable data can make financial analysis more difficult.
Common mistakes include:
- Overloading the dashboard with unnecessary information
- Using outdated or delayed data feeds
- Selecting inappropriate visualization formats
- Ignoring user customization requirements
- Using inconsistent financial metrics
- Failing to integrate with existing systems
- Providing too much detail without clear priorities
A dashboard should prioritize the information that decision-makers actually need rather than attempting to display every available data point.
How to Choose the Right Market Dashboard
Selecting a market dashboard requires consideration of both financial and technical requirements.
CFOs and treasury teams should evaluate:
- Reliability and quality of market data
- Real-time data availability
- Breadth of multi-asset market coverage
- Historical data availability
- Scalability of the platform
- User interface and visualization capabilities
- Customization options
- Alert and notification capabilities
- API integration and connectivity
- Security and access controls
The right solution should provide the required financial information while remaining intuitive and scalable as the organization’s requirements evolve.
Platforms such as Tresmark provide market dashboards with real-time multi-asset data, analytics, visualization, and customization capabilities designed to support treasury and financial professionals.
Designing a Dashboard for CFOs
CFO dashboards should prioritize high-level financial visibility rather than overwhelming users with excessive detail.
Important areas can include:
- Key market indicators
- FX and interest-rate movements
- Liquidity conditions
- Portfolio performance
- Major financial exposures
- Risk indicators
- Important macroeconomic developments
A CFO should be able to understand the broader financial environment quickly and then drill down into specific areas when more detailed analysis is required.
Designing a Dashboard for Treasury Teams
Treasury teams generally require more detailed and operational information than senior executives.
A treasury-focused dashboard may include:
- Real-time FX rates
- Currency exposure
- Interest-rate movements
- Yield curves
- Money-market rates
- Commodity prices
- Liquidity indicators
- Market alerts
- Historical market trends
Providing this information in a centralized environment can improve daily monitoring and help treasury professionals respond more quickly to changing market conditions.
The Role of Historical Data
Real-time data provides visibility into current market conditions, but historical data is equally important for financial analysis.
Historical market data can help treasury teams:
- Compare current rates with previous levels
- Identify market trends
- Analyze historical volatility
- Evaluate interest-rate cycles
- Assess currency movements
- Support forecasting and scenario analysis
Combining real-time and historical data allows financial professionals to understand not only what is happening now, but also how current conditions compare with previous market environments.
The Importance of Data Quality
A market dashboard is only as useful as the data behind it. Inaccurate, inconsistent, or delayed data can lead to incorrect analysis and potentially poor financial decisions.
Organizations should therefore consider:
- Data accuracy
- Data freshness
- Source reliability
- Consistency across markets
- Historical data quality
- Data validation processes
- Availability and system reliability
Reliable market data provides the foundation for effective financial analytics and decision-making.
The Future of Market Dashboards
Market dashboards are evolving alongside advances in artificial intelligence, cloud technology, real-time data infrastructure, automation, and financial analytics.
Future dashboards are likely to include:
- AI-driven market insights
- Predictive analytics
- Automated alerts and recommendations
- More advanced visualization capabilities
- Deeper integration with trading and risk systems
- Personalized financial intelligence
- Automated market commentary
- Scenario-based financial analysis
These developments can transform dashboards from passive information displays into more intelligent decision-support environments.
Why Market Dashboards Can Become a Competitive Advantage
In an increasingly data-driven financial environment, the ability to access and interpret market information quickly can provide an important competitive advantage.
Organizations with effective market dashboards can benefit from:
- Faster financial insights
- Better market visibility
- Improved risk management
- More efficient financial analysis
- Faster responses to market developments
- Better communication across finance teams
For CFOs and treasury professionals, this means using financial data not simply for reporting but as a strategic resource for decision-making.
Supporting Collaboration Across Finance Teams
Financial decisions often involve CFOs, treasury professionals, investment teams, risk managers, and other finance functions.
A centralized market dashboard can allow authorized users to access consistent financial information and analytical tools.
This can improve:
- Collaboration between finance teams
- Consistency of financial information
- Accessibility of reports and dashboards
- Communication with senior management
- Alignment between treasury and investment functions
A shared financial data environment can therefore help organizations create greater alignment across finance functions.
Market Dashboards and Modern Treasury Transformation
The future of treasury is increasingly connected to real-time data, automation, analytics, cloud technology, and financial intelligence.
A modern market dashboard can bring these capabilities together in one environment, allowing treasury teams to move away from fragmented and reactive processes toward more connected financial management.
This can help teams:
- Monitor financial markets continuously
- Improve forecasting and planning
- Track financial exposures
- Analyze market trends
- Strengthen risk management
- Support strategic decision-making
Conclusion
A good market dashboard is more than a collection of charts and financial indicators. It is a centralized decision-support tool that helps CFOs and treasury teams monitor markets, evaluate risks, and respond to changing financial conditions.
The most effective dashboards combine real-time data, multi-asset coverage, customization, intuitive visualization, alerts, historical data, and API connectivity. When these capabilities are integrated effectively, financial professionals can reduce manual analysis, improve market visibility, and make faster and more informed decisions.
For modern finance functions, the value of a dashboard ultimately depends on its ability to turn complex financial data into actionable information.
Platforms such as Tresmark can support these objectives by providing real-time multi-asset market data, analytics, visualization, and customizable dashboards, helping CFOs and treasury teams turn complex financial information into actionable market intelligence.
Frequently Asked Questions (FAQs)
- What is a market dashboard?
A market dashboard is a centralized digital interface that displays real-time financial market data, analytics, KPIs, and other important financial indicators across multiple asset classes.
- Why is a market dashboard important for treasury teams?
A market dashboard provides centralized and timely market information, helping treasury teams monitor exposures, identify risks, analyze market movements, and make faster financial decisions.
- What features should a good market dashboard have?
Key features include real-time data integration, multi-asset coverage, customization, advanced visualization, alerts and notifications, historical data, and API connectivity with other financial systems.
- How does a market dashboard improve risk management?
A market dashboard enables continuous monitoring of market conditions and financial exposures, helping treasury teams identify potential risks earlier and take more proactive risk management measures.
- Why is real-time market data important?
Real-time market data allows CFOs and treasury professionals to monitor current market conditions and respond more quickly to changes in FX rates, interest rates, commodities, equities, and other financial markets.
- Can market dashboards integrate with existing financial systems?
Yes. Modern market dashboards can use APIs to connect with treasury management systems, ERP platforms, risk systems, trading applications, reporting tools, and internal financial applications.
- What is the difference between a CFO dashboard and a treasury dashboard?
A CFO dashboard generally focuses on high-level financial visibility, major exposures, liquidity, risk indicators, and key market developments. A treasury dashboard typically provides more detailed operational information such as FX rates, yield curves, money-market rates, liquidity indicators, and market alerts.




Платформа платформа мультиваркових рецептів — це вдалий українською збірник із сотнею з гаком гарантованими рецептами під мультиварку. На цьому ресурсі опубліковані нескладні опис приготування на супів, яловичини, свинини, курки, випічки, круп’яних страв, овочевих страв, рибних страв та десертів. Візитівка — це ставка на простоту: заклав продукти, обрав програму — і все виходить. Багато страв готуються з мінімальним вмістом олії, результат однаково хороший для тих, хто нещодавно почав готувати. Досить часто з’являються нові нові рецепти (такі як хліб рисовий та полуничний пісочний пиріг), можна отримувати розсилку.