- November 28, 2025
- Posted by: Tresmark
- Category: Commodities
Real-time commodity data is crucial—but context is king. Without history, you can’t identify patterns, test strategies, or gauge anomalies. That’s where real-time feeds with historical charting step in.
Imagine seeing gold jump $30 in a day. Is it a breakout or just noise? Historical charts tell you whether this has happened before, during what kind of global events, and how long such rallies lasted.
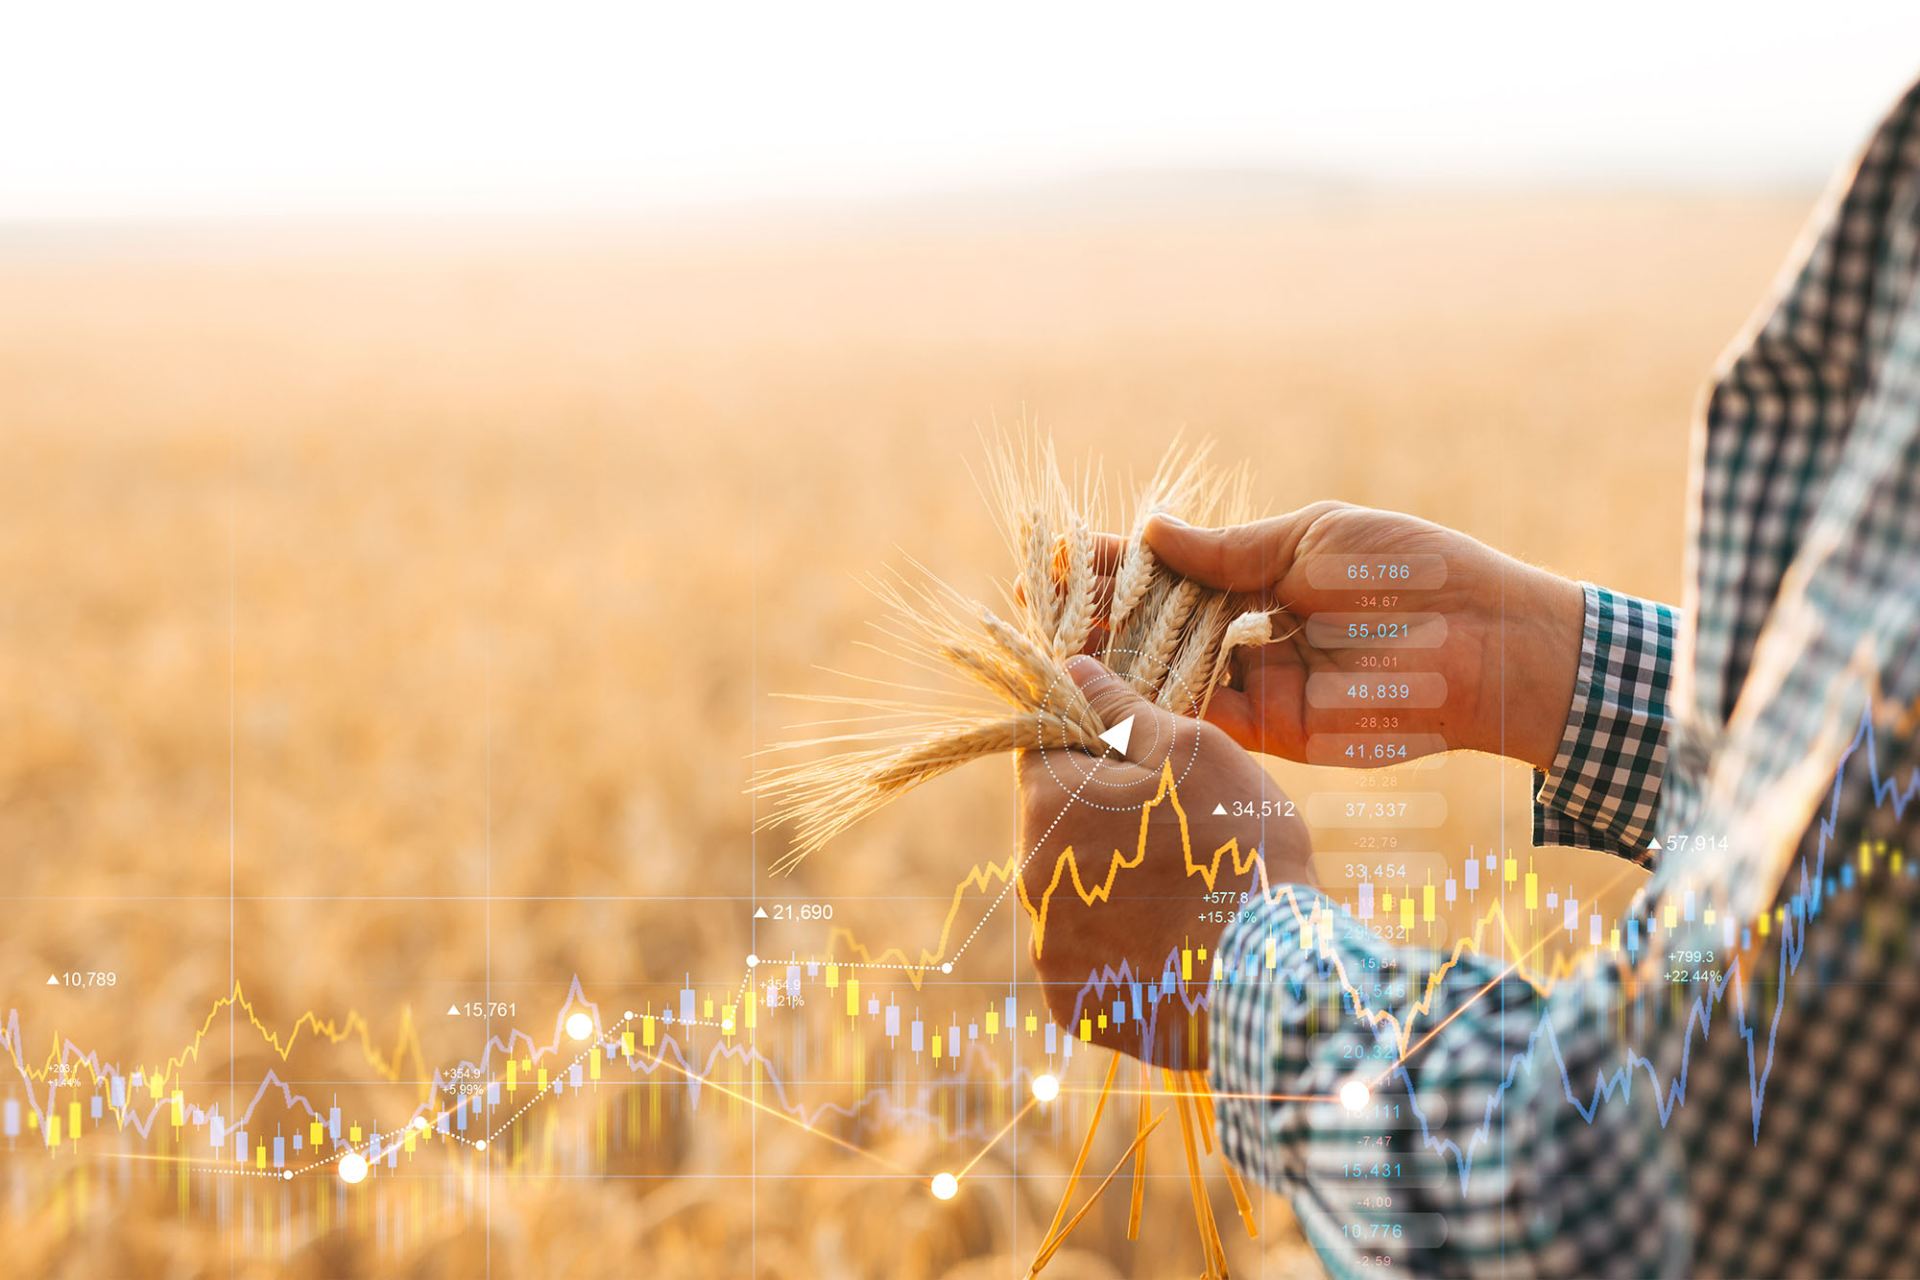
This is especially useful for commodities that spike seasonally (like gas) or cyclically (like copper). Overlaying past trends with current data can reveal price zones, support levels, and risk thresholds.
Traders, hedge funds, and corporates alike rely on such tools for risk management and strategy execution. Integrating with Excel or APIs, these feeds can support everything from simple alerts to algorithmic models.
With Tresmark, get the full picture—live prices, deep history, smart charts.