- December 3, 2025
- Posted by: Tresmark
- Category: Commodities
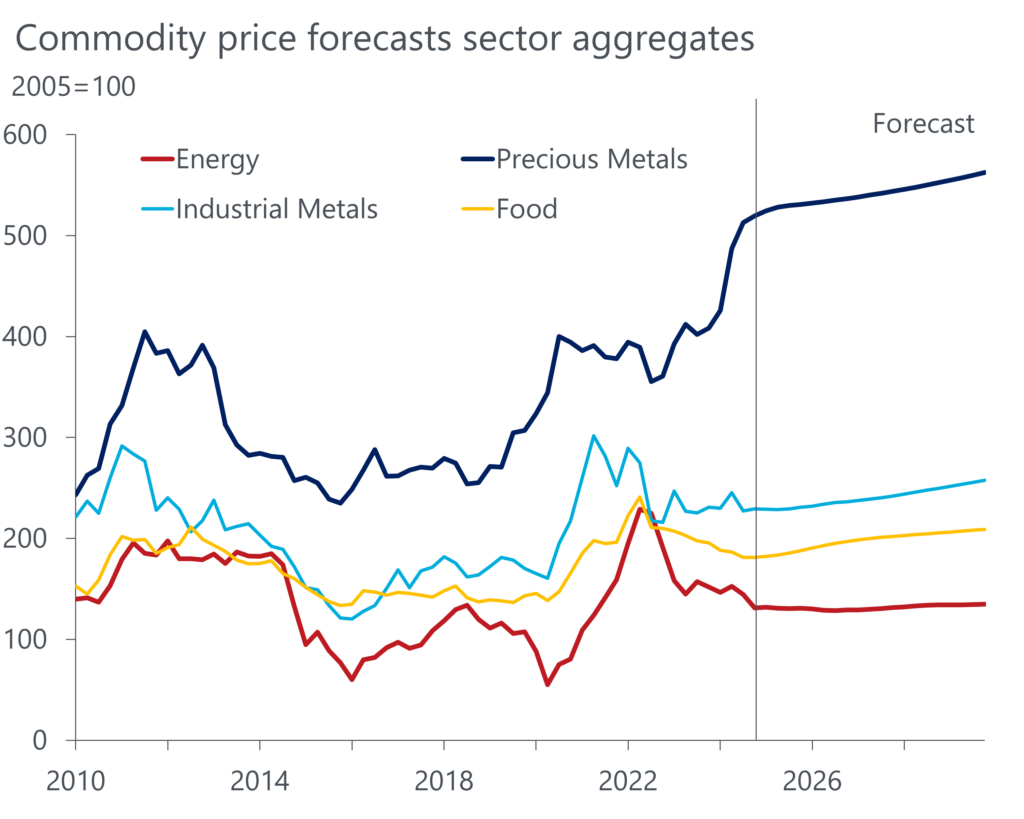
Each commodity group—metals, energy, and agri—behaves differently. Comparing them reveals cross-sector opportunities, inflation hedges, and portfolio diversification insights.
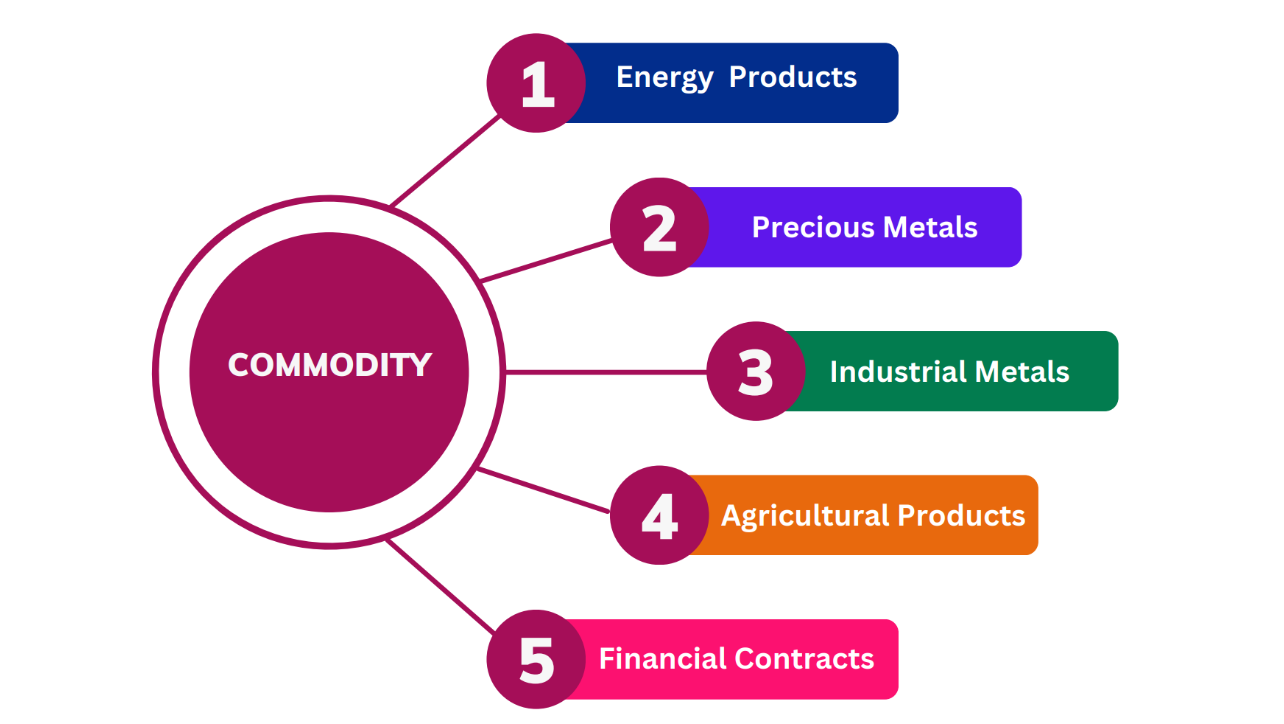
Metals like copper and iron signal industrial health. Energy products reflect macro and geopolitical trends. Agri commodities are tied to climate, population, and food security. But their prices don’t always move together.
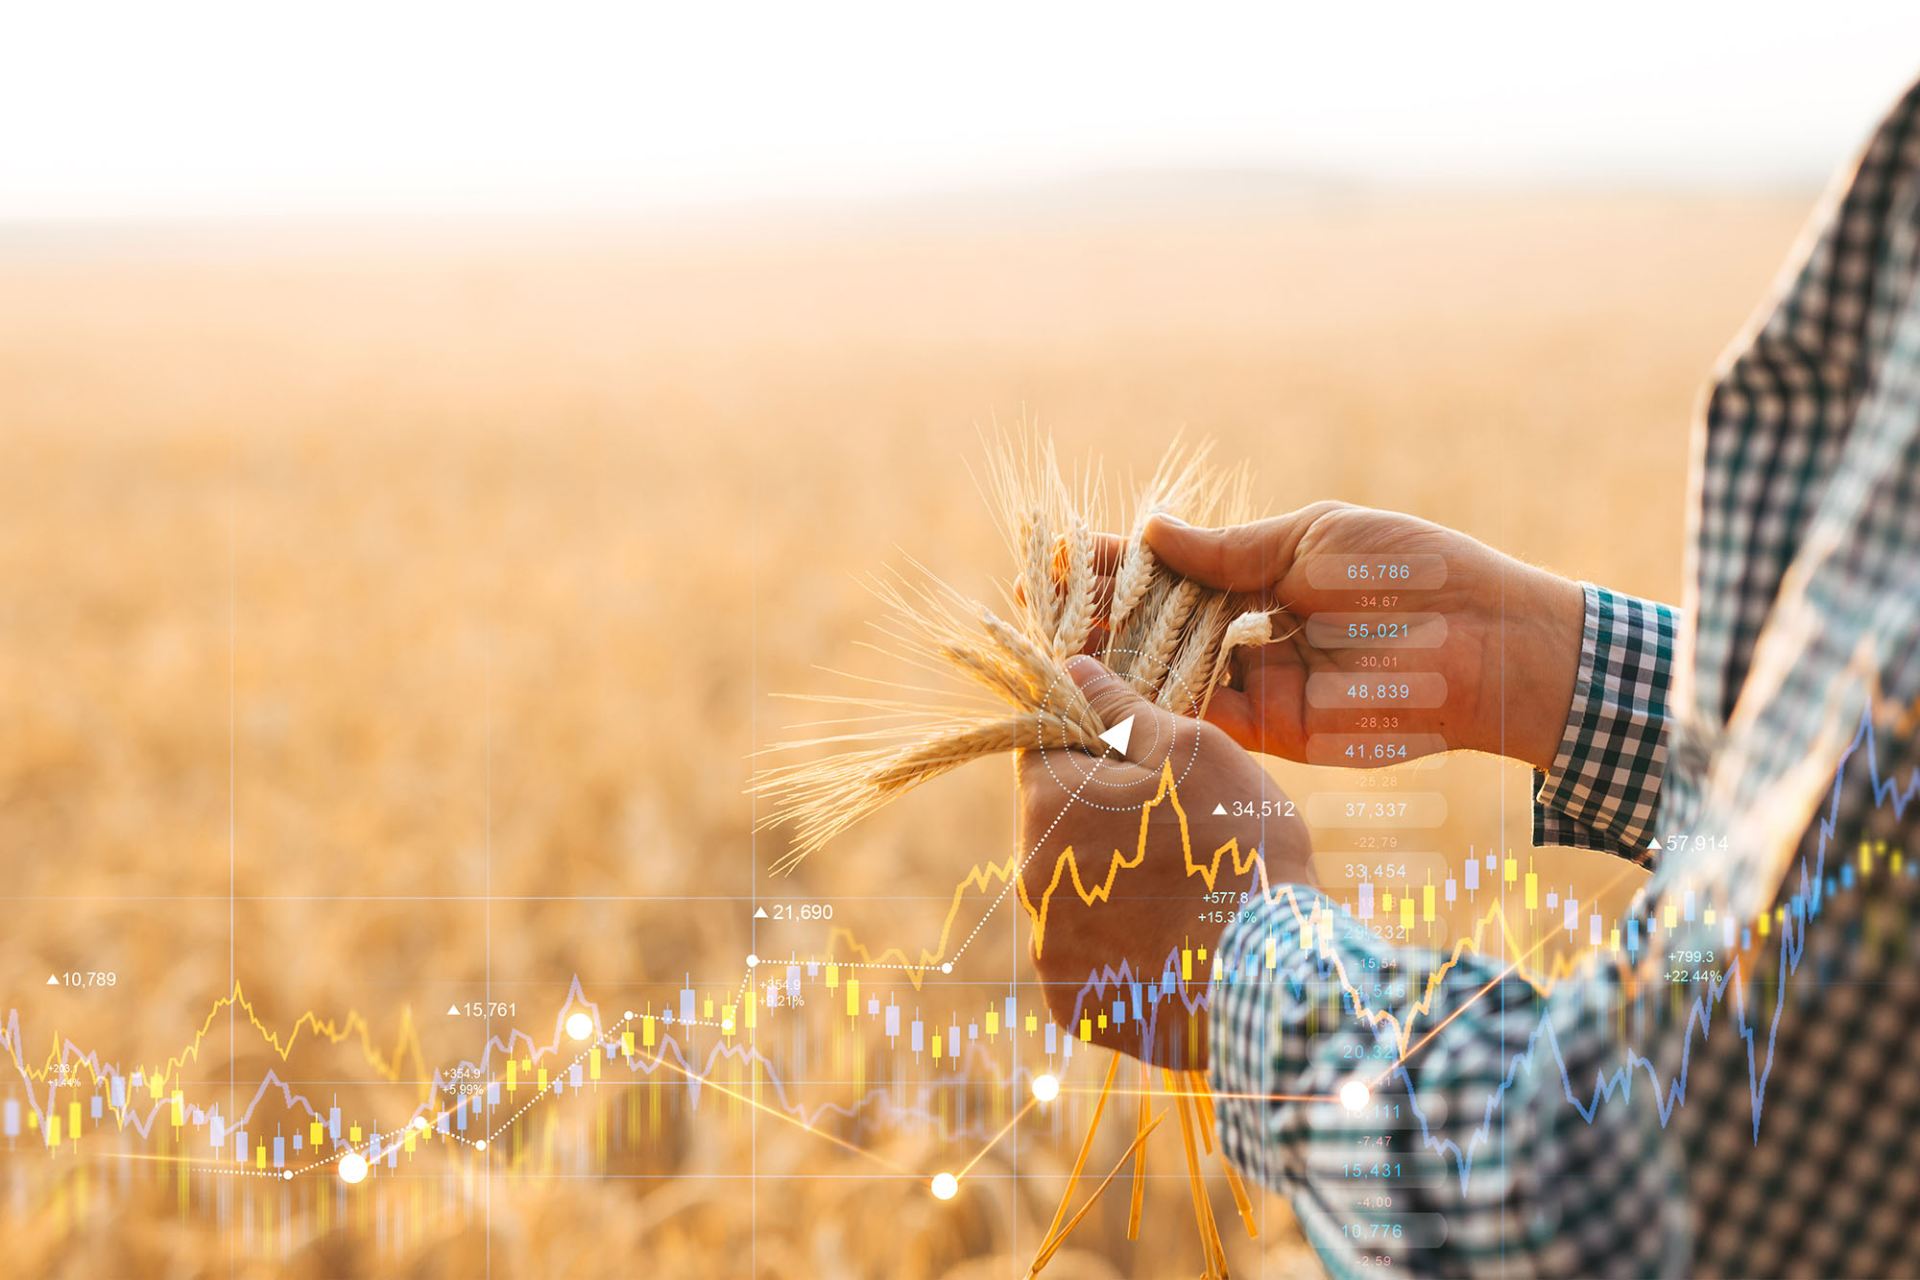
For example, a slowdown in China might pressure metals but boost grains (due to reduced ethanol demand). Oil and gas may spike on war threats, while wheat might remain steady unless transport routes are hit.
Professional traders compare sectors to judge relative strength, uncover laggards, or confirm inflation signals. Heatmaps, spreads, and correlation matrices help in drawing actionable insights.
Tresmark’s comparative tools make cross-commodity analysis simple and visual—so you don’t miss the bigger picture.